Share your expertise on the new Apache Pinot YouTube Channel!
DocsDownloadPowered byBlogCommunity

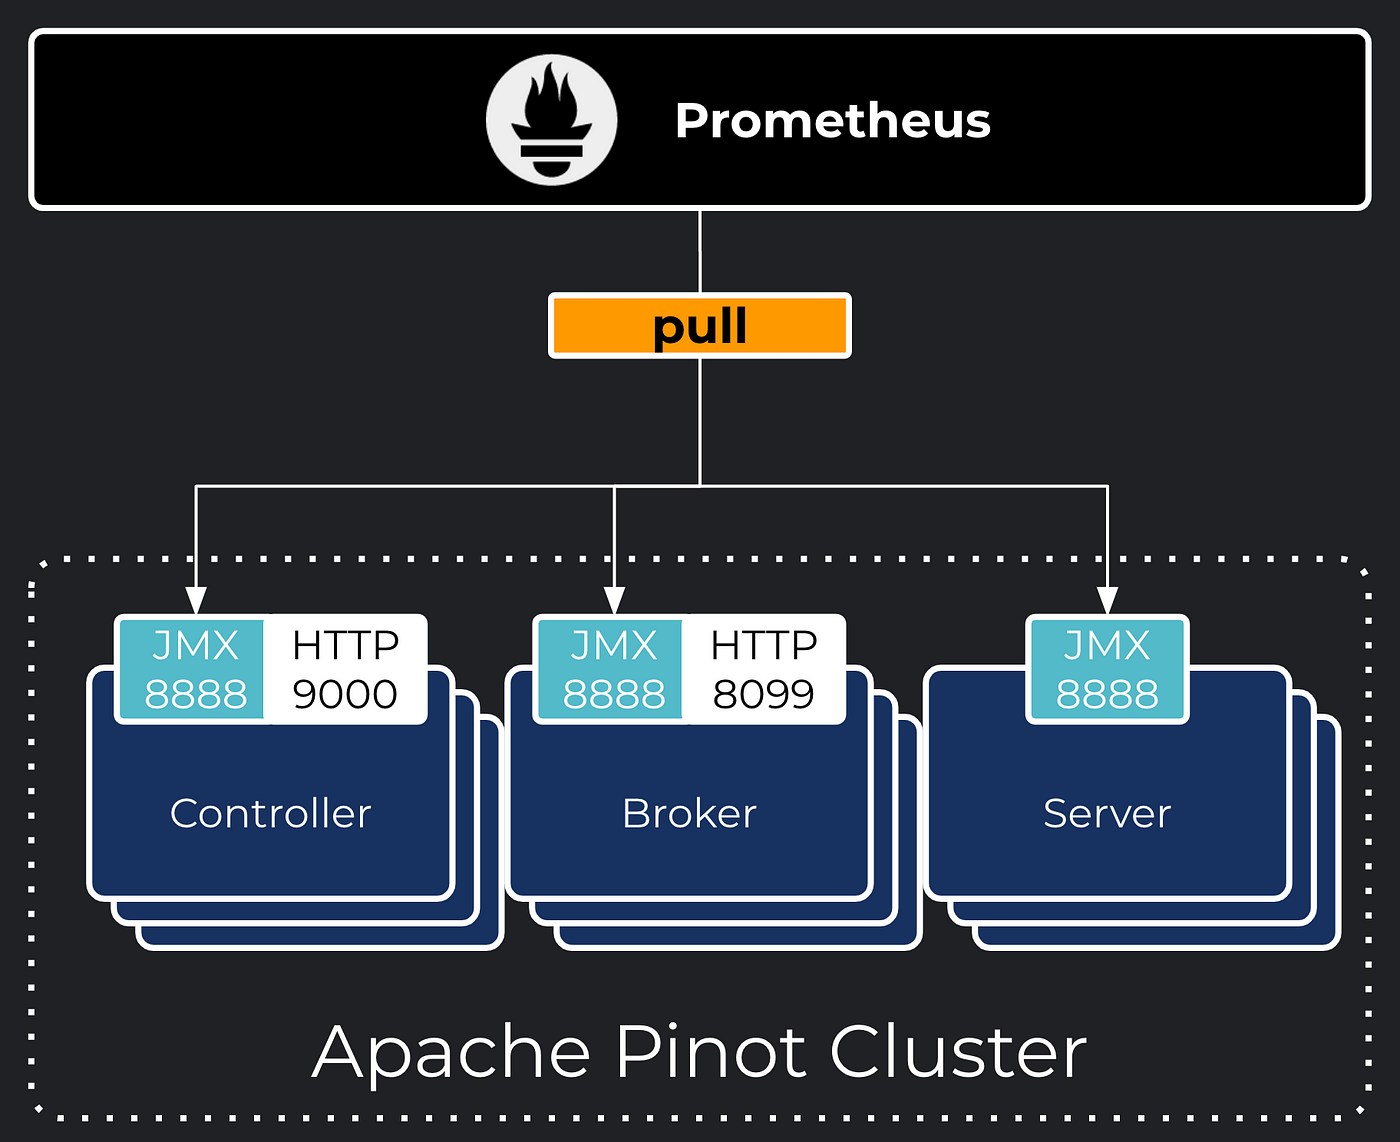
Monitoring Apache Pinot with JMX, Prometheus and Grafana

By: Pinot Dev

August 8th, 2020 • 1 min read

I may be kicking open doors here, but a simple question has always helped me start from somewhere. When it comes to investigating degraded user experience caused by latency, can I observe high resource usage on all or some nodes of the system?

Read more at https://medium.com/apache-pinot-developer-blog/monitoring-apache-pinot-99034050c1a5
Monitoring Apache Pinot with JMX, Prometheus and Grafana

Table of Contents

    Resources
    DocsGetting StartedThirdEye
    Company StoriesDownloadBlog
    Apache
    FoundationLicenseSecurity
    SponsorshipEventsThanks

    Join our newsletter

    Copyright © 2025 The Apache Software Foundation. Apache Pinot, Pinot, Apache, the Apache feather logo, and the Apache Pinot project logo are registered trademarks of The Apache Software Foundation. This page has references to third party software - Presto, PrestoDB, ThirdEye, Trino, TrinoDB, that are not part of the Apache Software Foundation and are not covered under the Apache License.